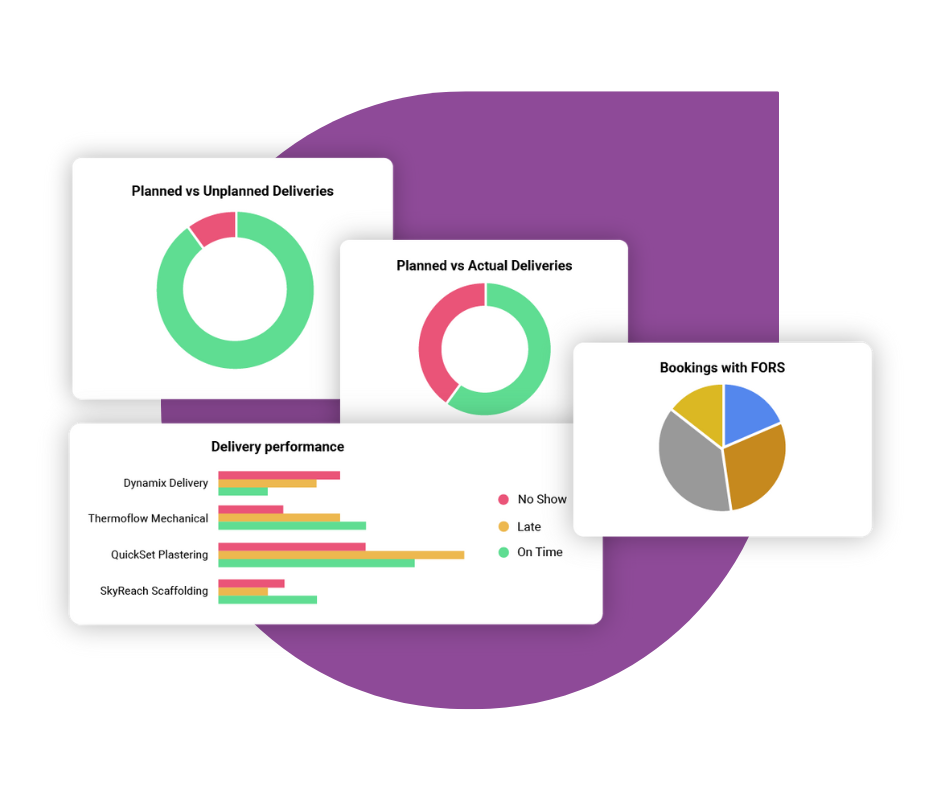
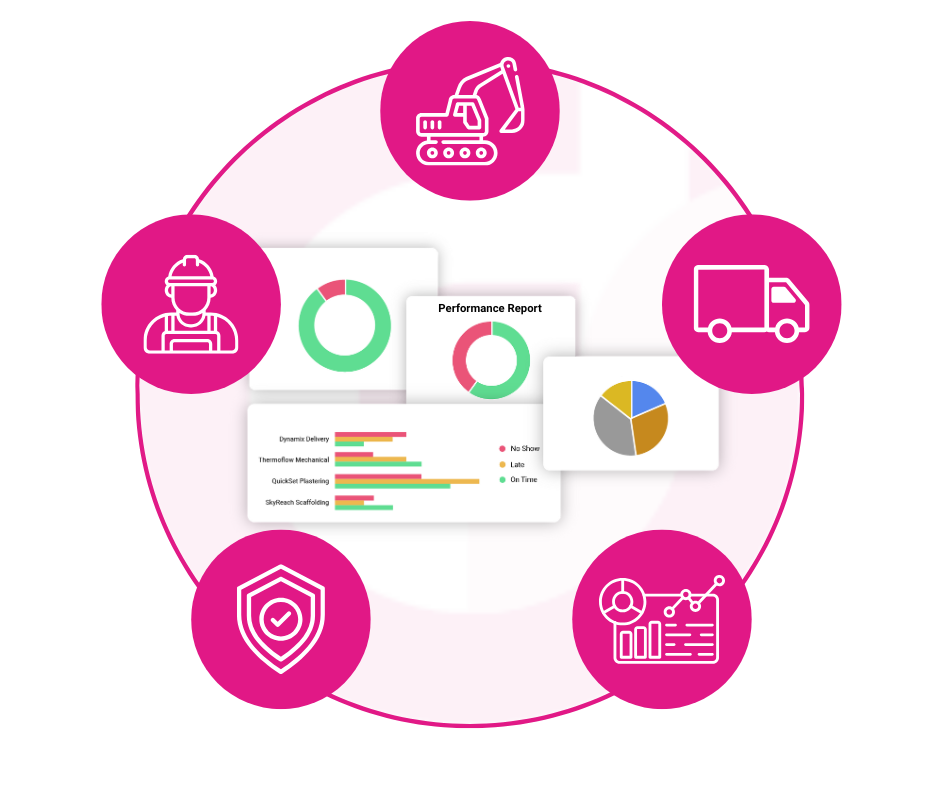
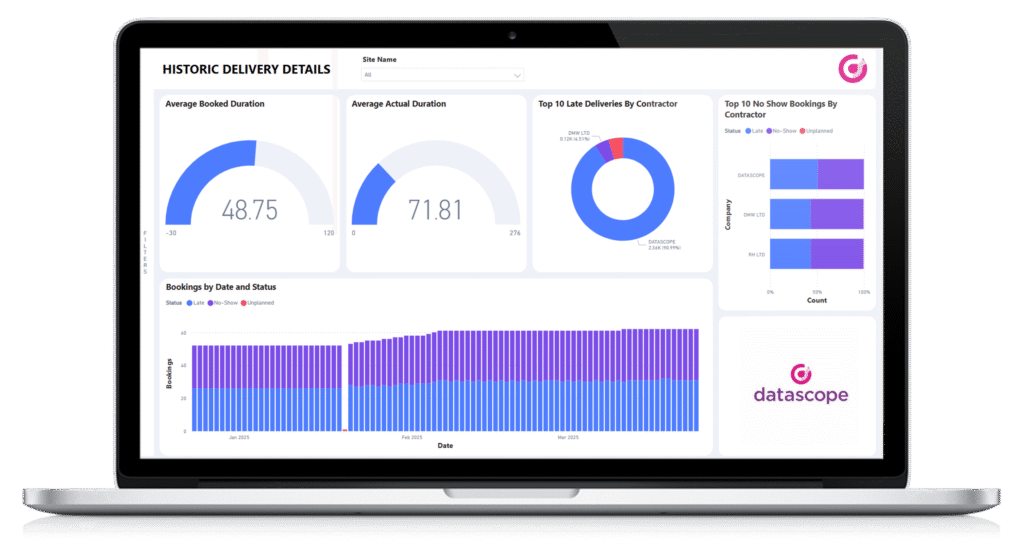
Dynamic reporting, clear visibility and a common understanding

Actionable insights
Understand project trends and issues quickly for faster, better decisions.
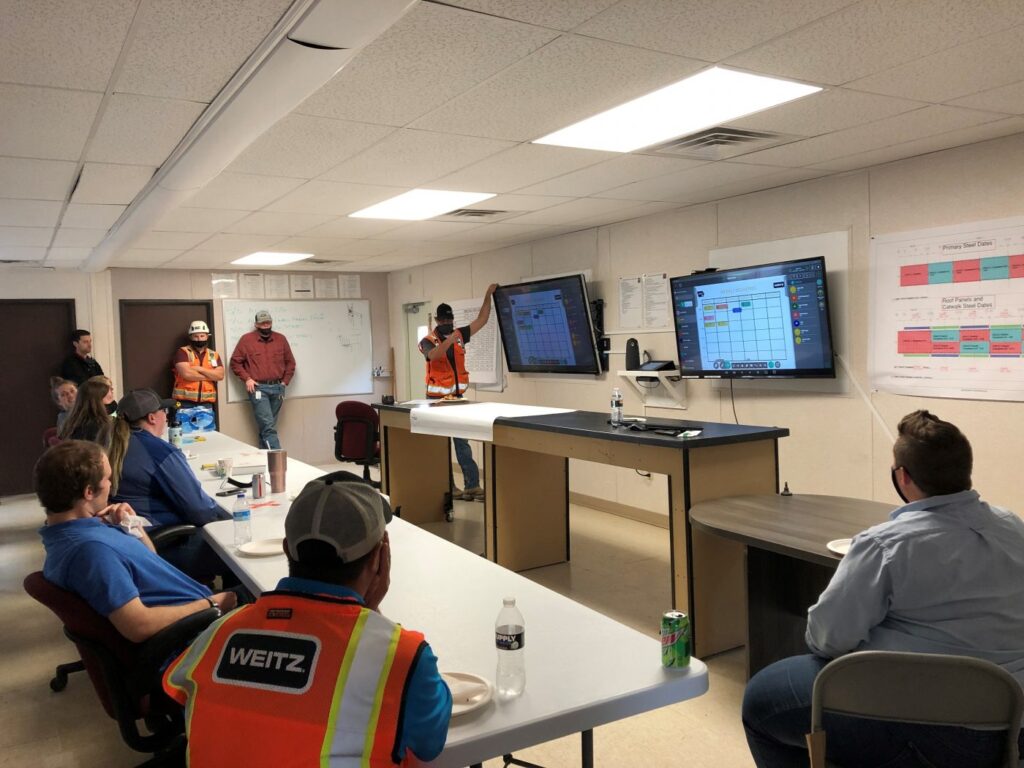
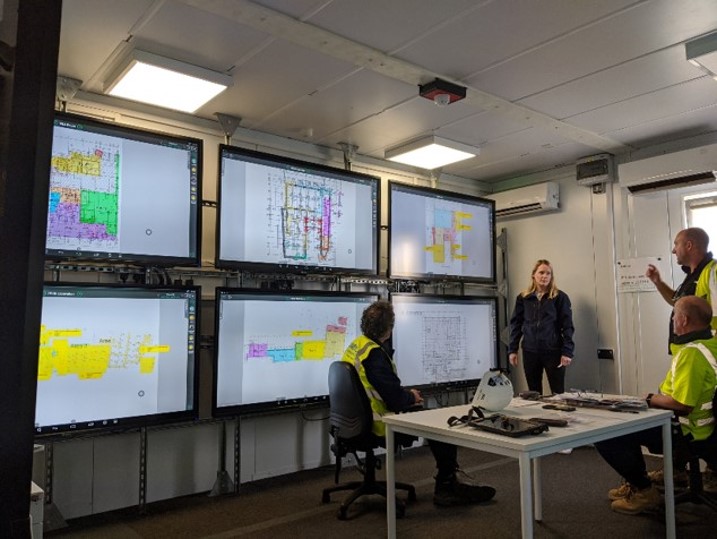
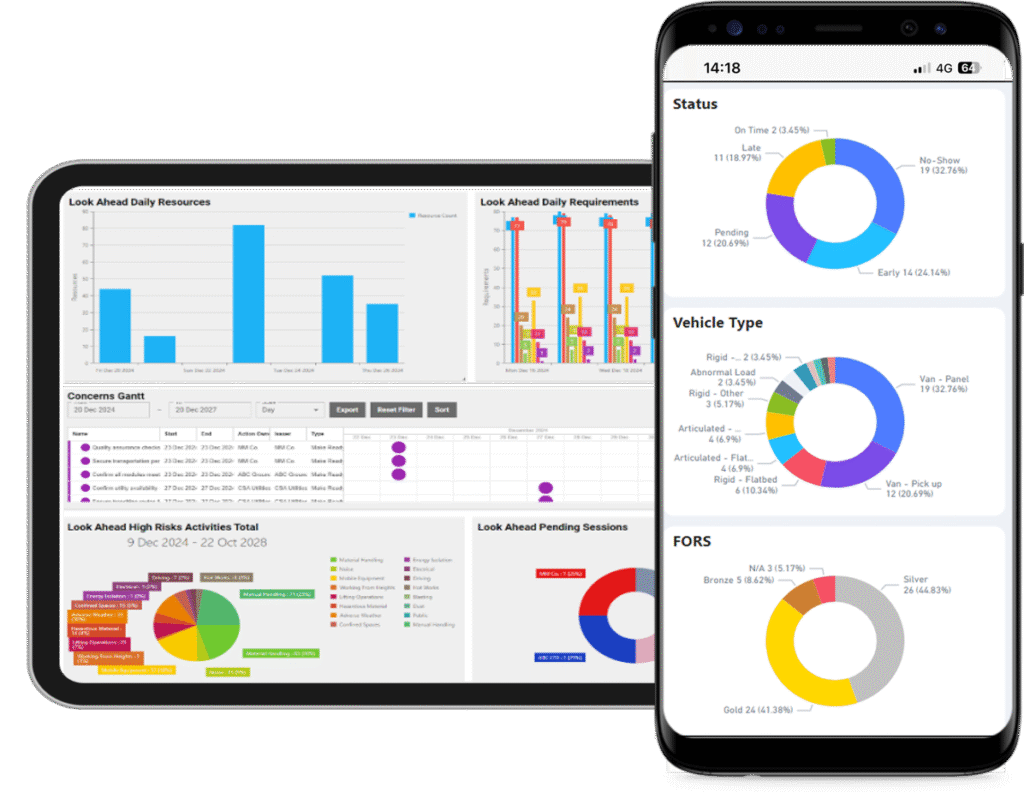
Full visibility
Bring everyone together from site to Head Office with full visibility across all the key measures in one place.

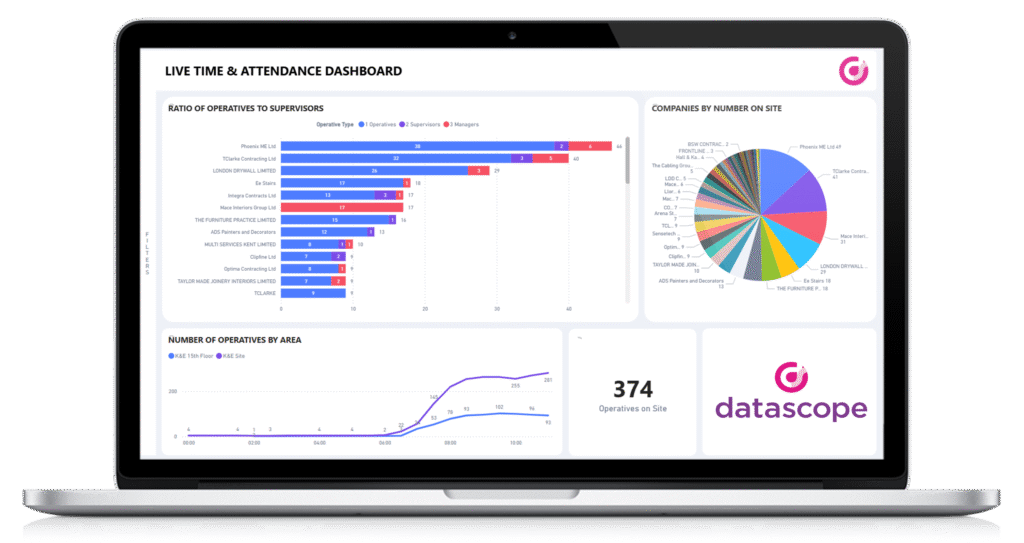
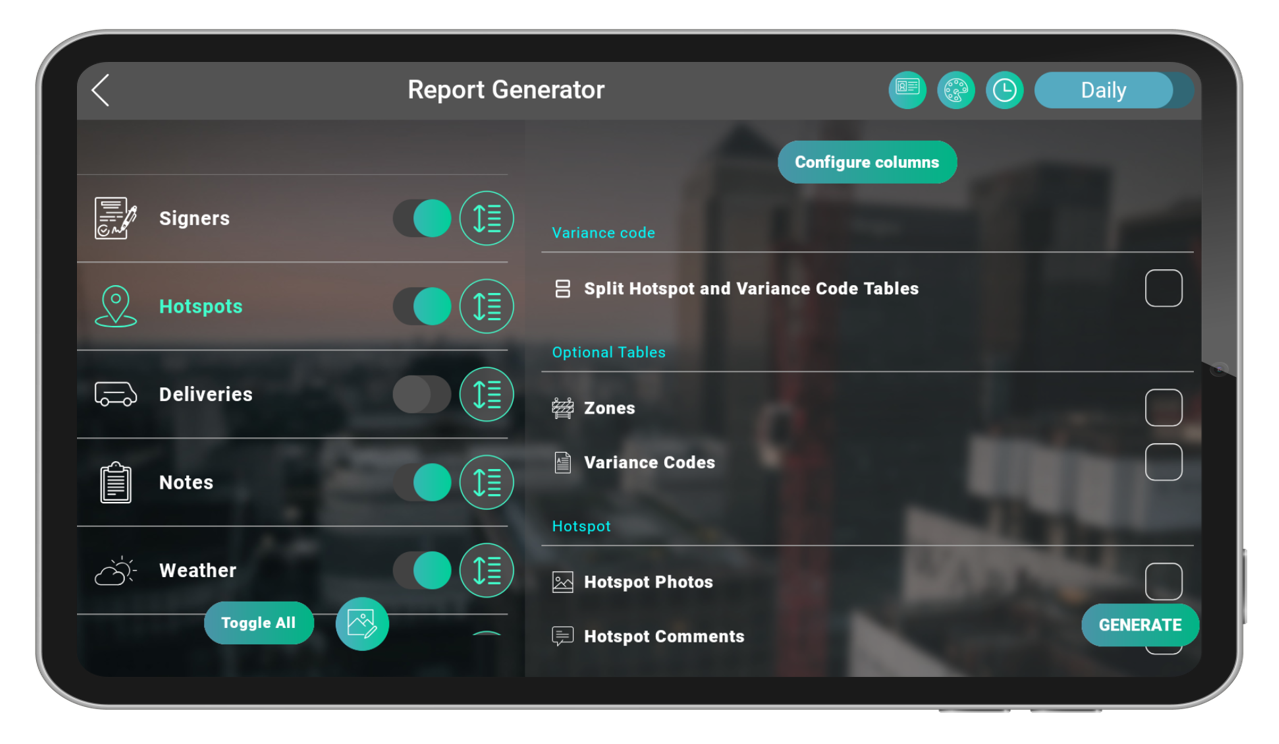
Consistent reporting
Standardised formats ensures joined up accuracy, measurability, and audit readiness.

Data-driven decisions
Make confident operational and strategic choices based on reliable metrics.
Gain clear, actionable insights built around your projects
DataScope transforms site and operational data into clear, interactive dashboards and reports. Teams at project and head office levels gain visibility of activities, trends, and compliance metrics. This unified reporting allows stakeholders to make informed decisions, track progress, and spot issues early.
By joining up data from multiple sources, DataScope ensures audit-ready, measurable, and consistent reporting, helping contractors manage projects more efficiently while improving safety, productivity, and overall delivery performance.
How DataScope’s reporting & dashboards work
Data captured from every source
Our system gathers information from across your sites – workforce, logistics, safety, and operations – automatically feeding it into a central platform.
Live dashboards with real time updates
Dashboards refresh in real time as data is entered or events occur on site. With DataTouch, DABS reports can be generated instantly, summarising task progress, high-risk activities, weather, and logistics in a single, visual report.
Custom views tailored to your needs
Dashboards are configured for each role and project. Users can filter, drill down, and focus on the metrics that matter to them. Ensure each user sees only what’s relevant, from detailed operational data for site teams to high-level summaries for executives.
Connected across your projects
DataScope dashboards integrate with all other system modules, so approvals, bookings, and updates feed directly into reporting – eliminating double entry and providing one source of truth.
Interactive and actionable analytics
Users can explore trends, compare sites or phases, and identify issues early. The dashboards turn raw data into clear, practical actions for teams and leadership.
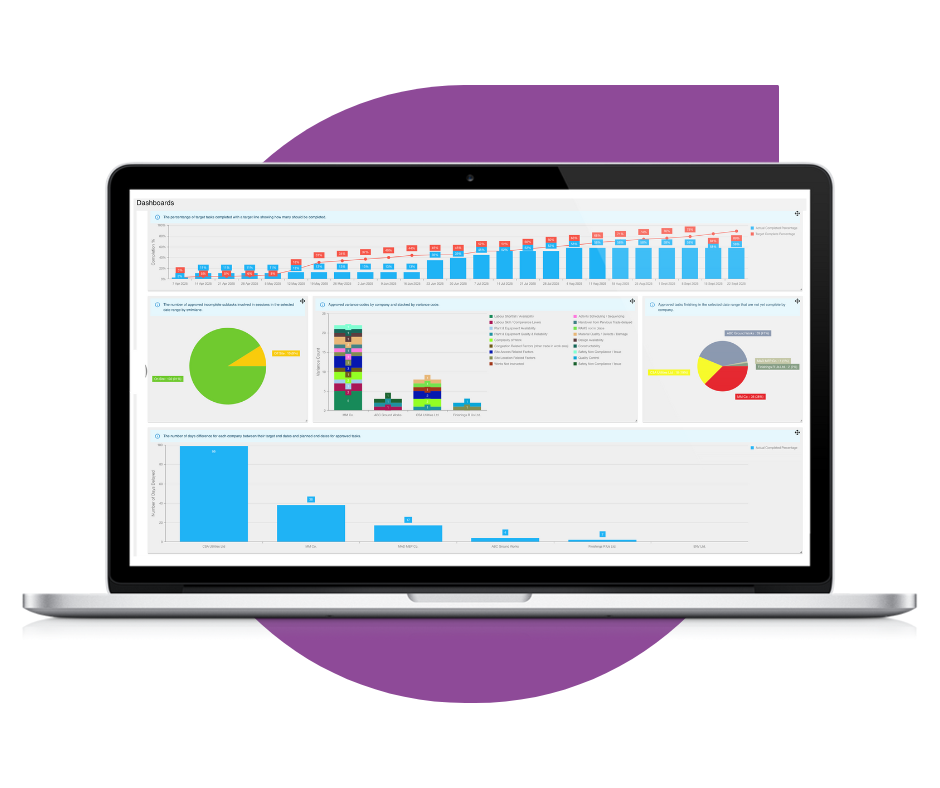
Multiple source data
Data captured from every source
Our system gathers information from across your sites – workforce, logistics, safety, and operations – automatically feeding it into a central platform.
Live dashboards
Live dashboards with real time updates
Dashboards refresh in real time as data is entered or events occur on site. With DataTouch, DABS reports can be generated instantly, summarising task progress, high-risk activities, weather, and logistics in a single, visual report.
Customised views
Custom views tailored to your needs
Dashboards are configured for each role and project. Users can filter, drill down, and focus on the metrics that matter to them. Ensure each user sees only what’s relevant, from detailed operational data for site teams to high-level summaries for executives.
Aggregate data across projects
Connected across your projects
DataScope dashboards integrate with all other system modules, so approvals, bookings, and updates feed directly into reporting – eliminating double entry and providing one source of truth.
Interactive analytics
Interactive and actionable analytics
Users can explore trends, compare sites or phases, and identify issues early. The dashboards turn raw data into clear, practical actions for teams and leadership.
Since we have adopted DataTouch the biggest benefits are the visuality and the interactivity of the product as well as the time it saves to generate reports and update task progress. The visuality really helps Weitz and the trades see where everyone is working during the week. This helps coordinate safety, access, and deliveries into a work zone.”
Will Treasure
Project Manager, The Weitz Company
Rather than each member of my team having to go into DataScope and pull off the data and put it in the right format, we get the information given directly to us. It ensures that we can use our time more effectively delivering social value for the local community rather than spending unnecessary time in data analysis.”
Suzanne Hardy
Head of Social Value - Construction, Mace
See real-time project performance through intuitive dashboards and reports
DataScope dashboards provide up-to-the-minute insight into site activity, deliveries, workforce compliance, and resource utilisation. Teams can instantly identify bottlenecks, monitor KPIs, and ensure projects stay on track.
These live reports enable proactive decision-making, reduce manual data chasing, and create a single source of truth for operational performance, helping project managers maintain efficiency and visibility without relying on fragmented spreadsheets or disconnected systems.
Streamline head office oversight with consolidated reporting across sites
Head office teams benefit from a centralised view of all project activity. By aggregating data from multiple sites, dashboards provide comparative insights and high-level summaries.
This ensures executives can monitor trends, benchmark performance, and make strategic decisions confidently. Centralised reporting reduces reporting time, avoids data inconsistencies, and supports transparent communication with clients, stakeholders, and compliance regulators.
Ensure auditable, consistent, and measurable reporting across your organisation
DataScope reports are designed to provide fully auditable records of site and operational activity. Standardised formats ensure consistency across teams, projects, and time periods, making compliance checks straightforward.
By combining historical data with live updates, teams can demonstrate accountability, meet regulatory requirements, and maintain traceable evidence of decisions and actions, reducing risk and reinforcing governance across the business.
Support better decisions through data-driven insights and storytelling
Our dashboards not only show metrics but also help teams tell the story behind the data. Visualisation and reporting tools highlight trends, correlations, and outcomes, making complex operational information actionable.
This enables managers to identify areas for improvement, optimise resource allocation, and justify interventions with confidence. Clear data storytelling aligns teams, promotes accountability, and drives smarter decision-making across projects and departments.
FAQs
What reporting comes with DataScope services?
All systems include a powerful reporting engine as standard. You get instant access to key workforce, logistics, H&S, and planning reports.
Can reports be customised for our projects?
Yes. We work with your team to create tailor-made dashboards and reports that give you the insights you actually need.
Can dashboards integrate with other tools?
Yes. They connect with Power BI and third-party systems, giving you one central view of all your project data.
Can reporting be automated?
Yes. Reports can be generated and sent automatically, keeping your team informed without extra admin.
How flexible are the visualisations?
Very flexible! Choose from a wide range of visualisations and drill down into specific sites, tasks, or companies to see exactly what’s happening.
How does this help day-to-day site management?
It turns raw data into clear, actionable insights. Teams can track tasks, manage logistics, monitor safety, and make faster, smarter decisions.
Related resources
Insight and opinion
Expert perspectives on digital construction, productivity, and safety from our team.
Customer stories
Real project stories showing how DataScope adds value and solves challenges.
Webinars and events
Learn, share, and connect through our industry webinars and live events.
Company news
Updates on our people, products, and progress shaping construction’s digital future.