


For decades, the construction industry has recognised the productivity challenge. While countless reports have highlighted the need to improve collaboration, reduce inefficiency and modernise project delivery, measuring meaningful progress has often proved difficult.
That’s why we welcomed Mace Construct’s Build Smart, Build Better report. By analysing data from 234 projects delivered over five years, it brings objective evidence to one of the industry’s biggest challenges and helps move the conversation from opinion to insight.
As one of Mace’s technology partners, we’re pleased to see this discussion being driven by real project data. We hope it’s the start of a broader industry conversation.
From data to decisions
One of the report’s strongest messages is that productivity isn’t driven by a single initiative. Workforce stability, planning, digital coordination and effective project delivery are all interconnected, and understanding their impact requires reliable, measurable data. This reflects what we see across many of the projects we support.
The highest-performing teams don’t simply digitise individual processes, they connect workforce, operational and safety information to create a clearer picture of what’s happening on site. When project teams have trusted, real-time information, they spend less time searching for answers and more time making informed decisions.
How to get more from your workforce data
One of the most powerful aspects of Mace Construct’s Build Smart, Build Better report is its use of workforce data to measure productivity and quantify the impact of workforce stability on project performance. It’s a great example of how operational data can become a strategic asset when it’s collected consistently and analysed effectively.
But collecting workforce data is only the first step. The quality of the insight depends entirely on the quality of the data behind it.
Here are some additional practical ways organisations can make their workforce data work harder.

1) Measure Workforce Churn Before It Impacts Productivity
One of the most valuable insights highlighted in Build Smart, Build Better is the relationship between workforce stability and project productivity. Understanding workforce stability starts with measuring workforce churn accurately.
The workforce data captured by DataScope was used to help Mace calculate that churn on a 500-worker site causes £2,266 in lost output per hour, rising to £20,000 per hour on 2,000-worker sites.
It’s one thing knowing how many people are on site today, but another to know how many have left the project over the past month, how quickly new operatives are replacing them, or which trades and subcontractors are experiencing the highest turnover.
A workforce management system provides a consistent, real-time view of workforce movement by recording every worker’s lifecycle on the project. from onboarding and induction through to their final swipe off site.
This allows project teams to monitor metrics such as:
- Workforce turnover by trade, subcontractor or employer.
- New starters versus leavers over time.
- Average workforce tenure on the project..
Rather than relying on anecdotal evidence or manual reporting, projects can identify trends as they emerge. If a particular subcontractor is continually replacing operatives, or if critical trades are experiencing unusually high turnover, project teams gain an early opportunity to understand the root cause and take action.
2) Define meaningful access zones
Knowing someone arrived on site isn’t the same as knowing when productive work began. Only controlling access at the site perimeter prevents projects from accurately measuring workforce productivity.
By creating logical access zones and using access control points to control them, projects can understand and properly measure:
- When workers arrive on site.
- When they enter productive work areas
- Time spent in welfare or logistics areas
3) Supervisor Ratios: An Early Indicator of Project Performance
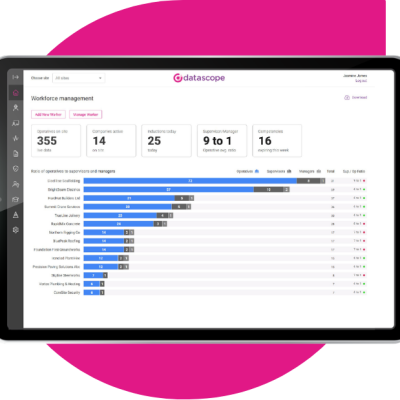
Most contractors know that that headcount tells you how many people are on site, but supervisor ratios tell you whether teams are set up to work safely and productively. The challenge is that many projects don’t have an accurate, real-time view of this ratio.
By maintaining structured workforce data, including role, trade, employer and reporting line, projects can continuously monitor supervisor-to-operative ratios across the entire site, by subcontractor, trade or work area.
This allows project teams to answer questions such as:
- Are we maintaining the agreed supervision levels across every work package?
- Which subcontractors are under-supervised?
- Are supervision levels changing as the workforce grows?
Rather than relying on periodic headcounts or manual reporting, workforce management data enables these metrics to be monitored continuously, giving project teams an early warning before issues begin to affect productivity, quality or safety.
4) Link Workforce Data to Real Work Activity
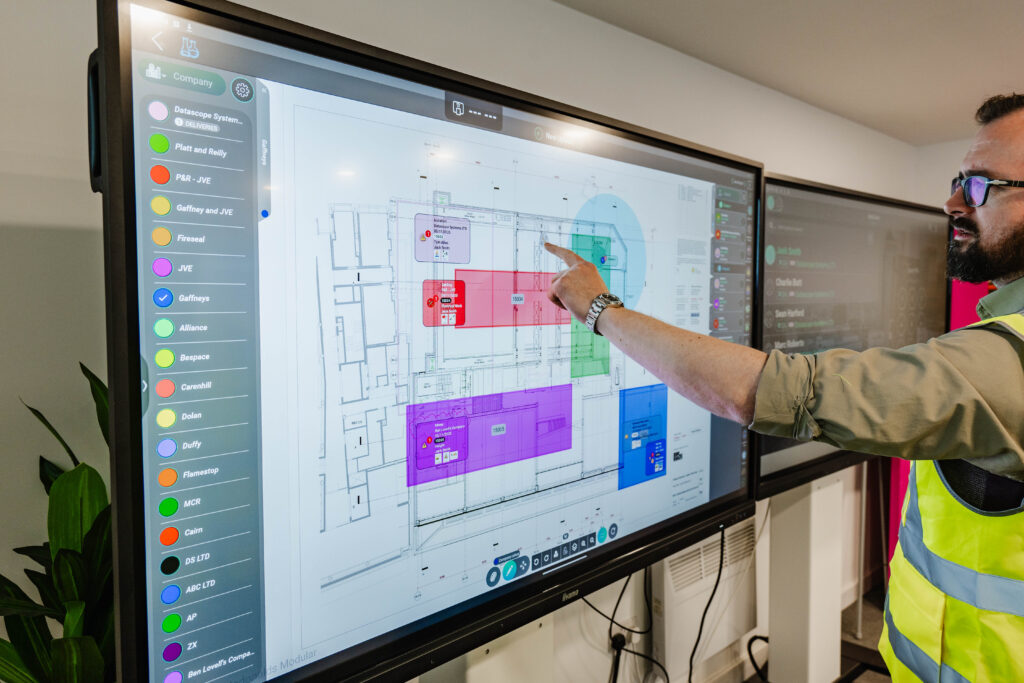
Most workforce systems can tell you who is on site, far fewer can tell you what work they’re supporting.
Without that context, headcount becomes little more than a number. You might know that 500 people are on site today, but are they in the right location? Do you have the right trade mix for today’s activities? Are resources aligned with the programme? The real value comes from connecting workforce data with planned work.
By linking every worker to their trade, work package, and work location, project teams can compare labour deployment against planned activities in real time. Instead of simply measuring attendance, they gain visibility into whether the workforce is supporting the work that matters most.
This enables teams to answer questions such as:
- Do today’s workforce levels reflect the activities planned for each work area?
- Are critical work packages adequately resourced?
- Are operatives spending time in the areas where productive work is planned?
- Has the workforce been briefed
Ultimately, productivity isn’t measured by how many people are on site, it’s measured by how effectively the workforce is aligned with the work that needs to be delivered. Connecting workforce data with operational activity gives project teams the visibility to identify gaps early, deploy labour more effectively and make better-informed decisions throughout the day.
5) Turning insight into action
At DataScope, we believe connected operational data is fundamental to improving productivity. By bringing together workforce management, operational coordination and safety processes in a single platform, project teams gain a clearer picture of what’s happening on site every day.
This helps teams:
- Build a more stable and compliant workforce.
- Improve coordination between planned and live site activities.
- Give project leaders real-time operational insight.
- Identify trends and opportunities for improvement across projects and portfolios.
Technology alone doesn’t improve productivity, but it can provide the trusted information that enables better decisions and continuous improvement.
A positive step for the industry
Construction faces an unprecedented pipeline of work over the coming decade. Improving productivity is essential if the industry is to deliver safely, efficiently and at scale.
Reports like Build Smart, Build Better are important because they encourage evidence-based conversations and greater collaboration across the sector. We congratulate the Mace team on producing such valuable research and contributing openly to one of construction’s biggest opportunities.
Get in touch to learn about how DataScope can help you measure and improve productivity on your project.