All DataScope services include a mature reports engine as standard. While we have a standard set of reports for each of our systems, we pride ourselves on working closely with our clients to develop tailor-made workforce, logistics, health & safety and production planning reports & dashboards to help construction teams get useful insights into their project data.
|
Custom Reporting Purpose-built software allows us to create reports based on any data sets captured by our systems.
|
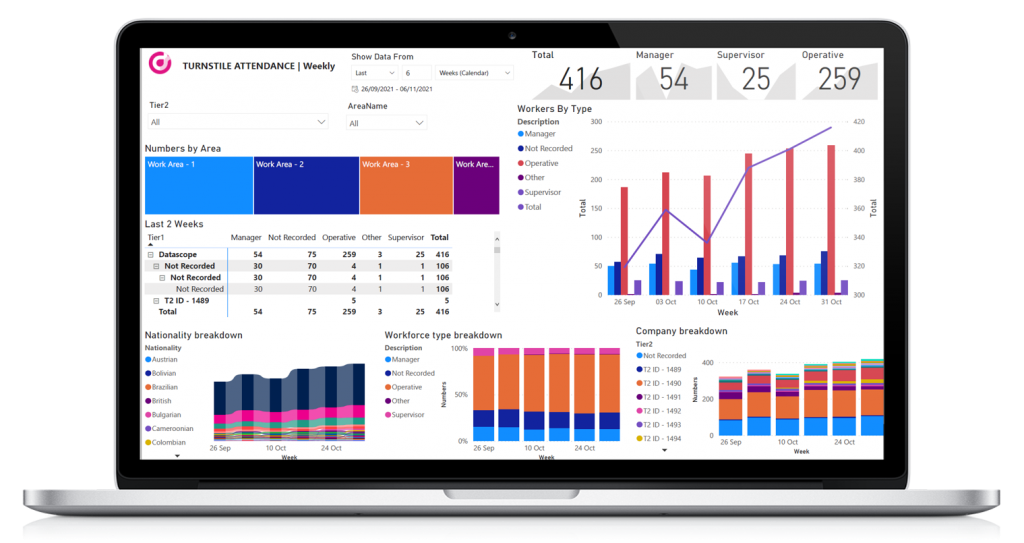
BI Integration Dynamic integration with PowerBI allows us to design bespoke dashboards on any of your construction project data. |
Reporting Automation Our systems can automatically create and send regular reports to those who need them most.
|
|
Export Options Export reports in a range of formats to share with internal and external stakeholders. |
Reporting Integration We support integration via API to third party data warehousing for wider reporting and analytical requirements. |
Data Visualisation Use a wide range of visualisations to highlight key project metrics. |
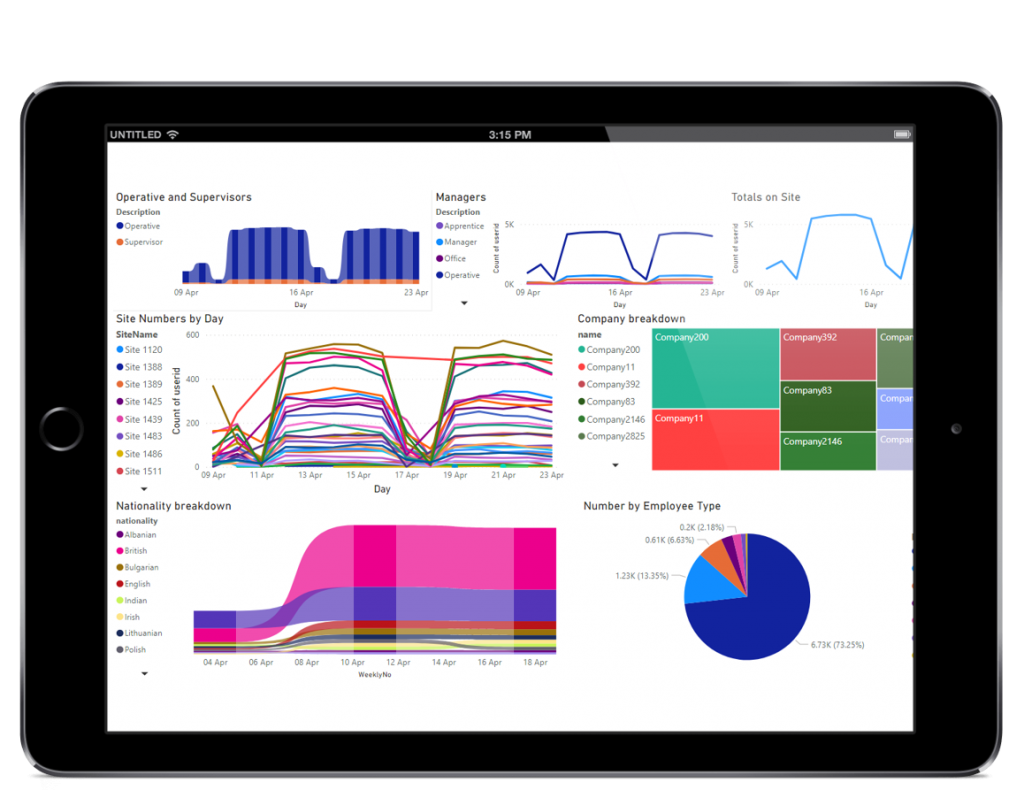
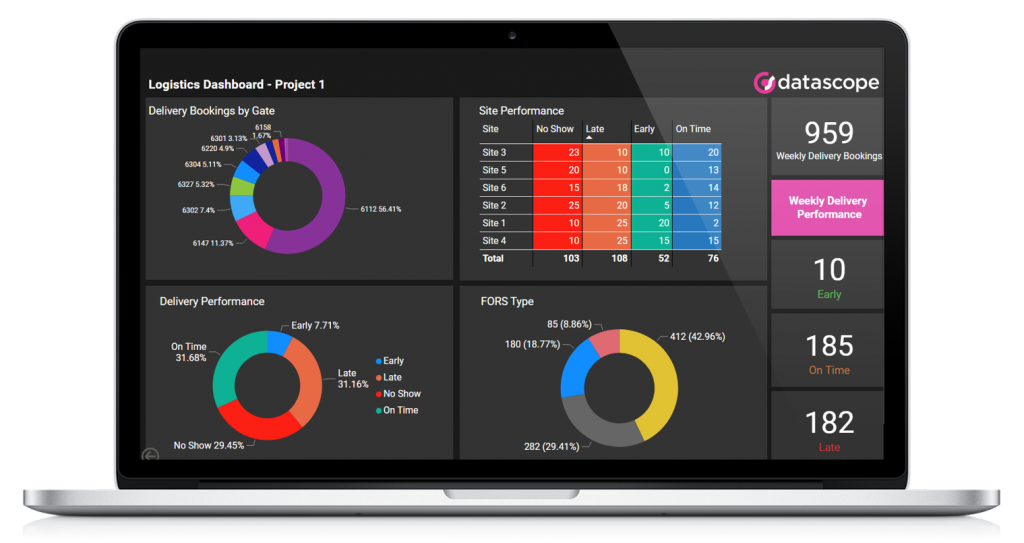
Go Beyond Data CollectionPowerful reports on your Workforce, Deliveries, Daily Briefings, Health & Safety processes and more.DataScope can provide data feeds and build powerful BI dashboards to help visualise critical construction project data. View live site information in real time and drill down to view site, company and trace-specific information.
|
|
We offer mature, comprehensive reporting across all of our systems. All of our systems include a comprehensive set of reports as standard, but this can be expanded on to create bespoke reports from any data collected by our systems.
 |
|
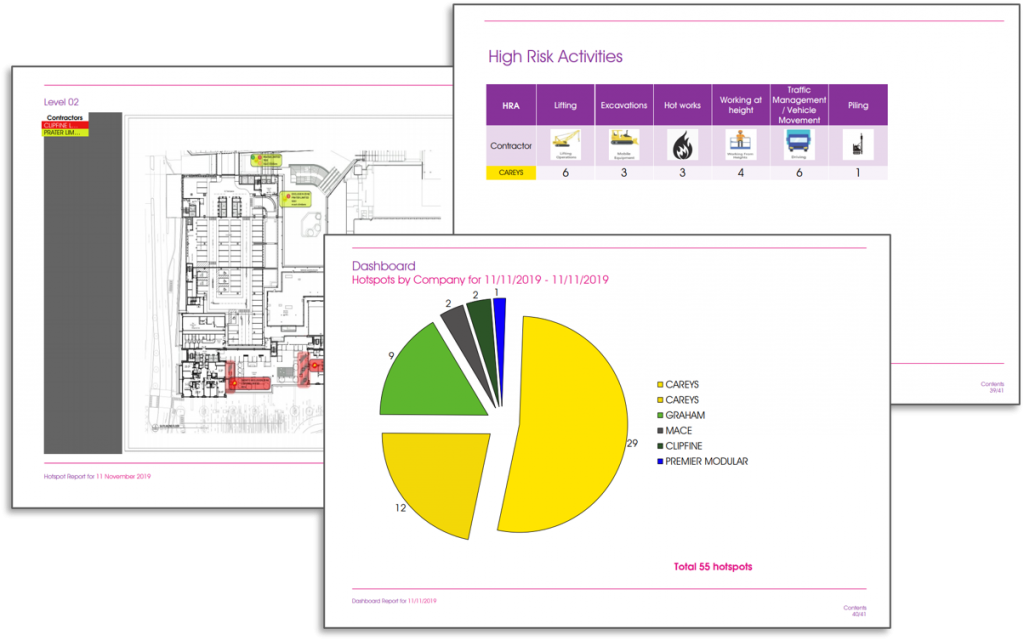
Digital DABS ReportsOur ground-breaking, award-winning solution DataTouch uses cutting edge software to allow project teams to generate their Daily Activity Briefing report with just a click of a button to generate visual, comprehensive report showing:
|
|
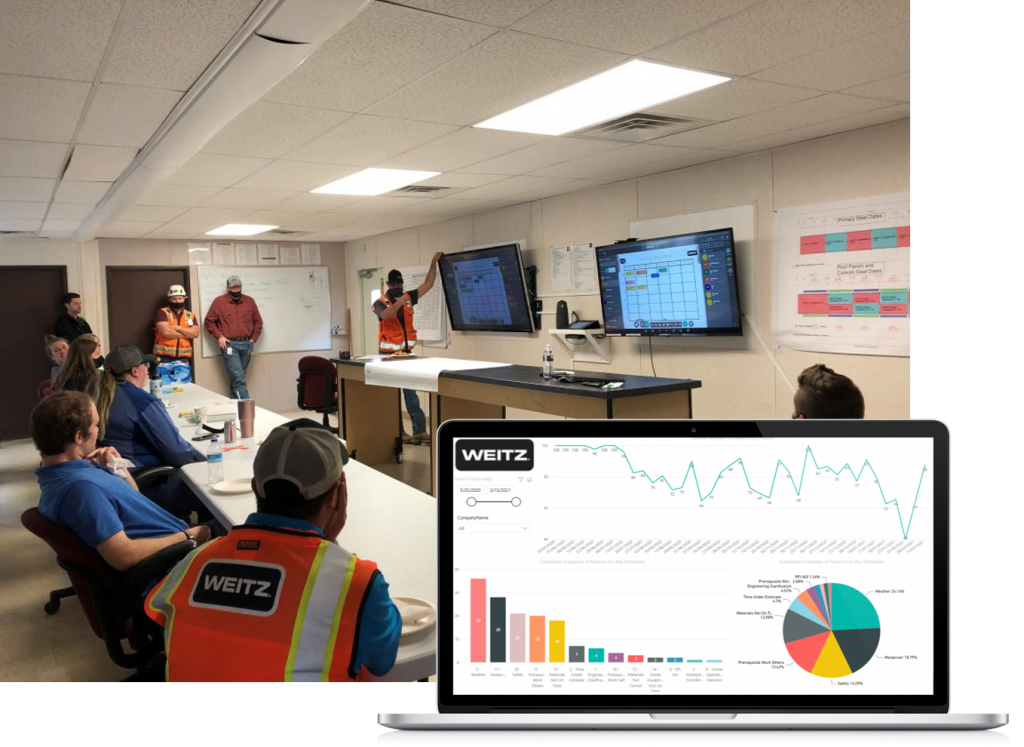
Case Study – Weitz“Since we have adopted DataTouch the biggest benefits are the visuality and the interactivity of the product as well as the time it saves to generate reports and update task progress. The visuality really helps Weitz and the trades see where everyone is working during the week. This helps coordinate safety, access, and deliveries into a work zone.”Find out how Weitz automated their reporting and utilised our dashboarding services to visualise all site planned activities and project progress as well as any reasons for deviations in our case study. |
|