


To find out about these or any of our other products, or to request a demonstration or a quote, please do not hesitate to get in touch with a member of our team
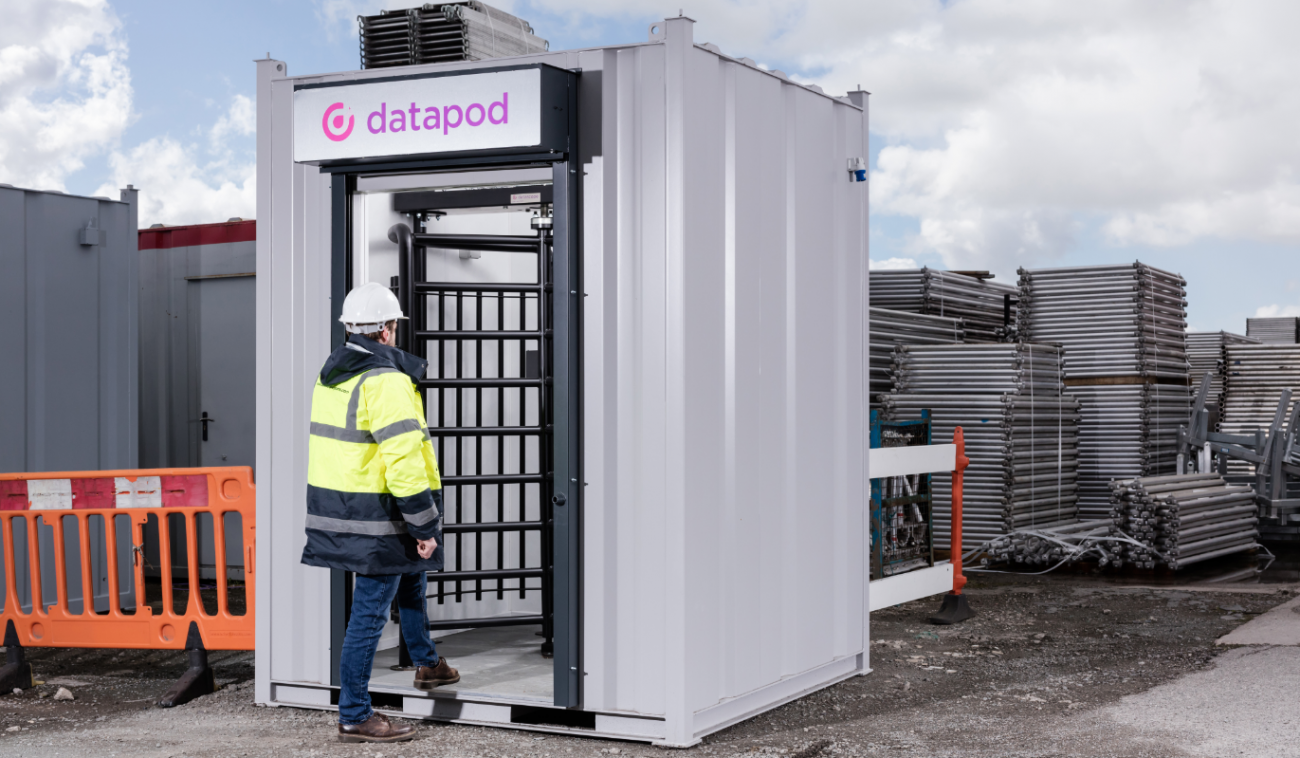
- Access Control
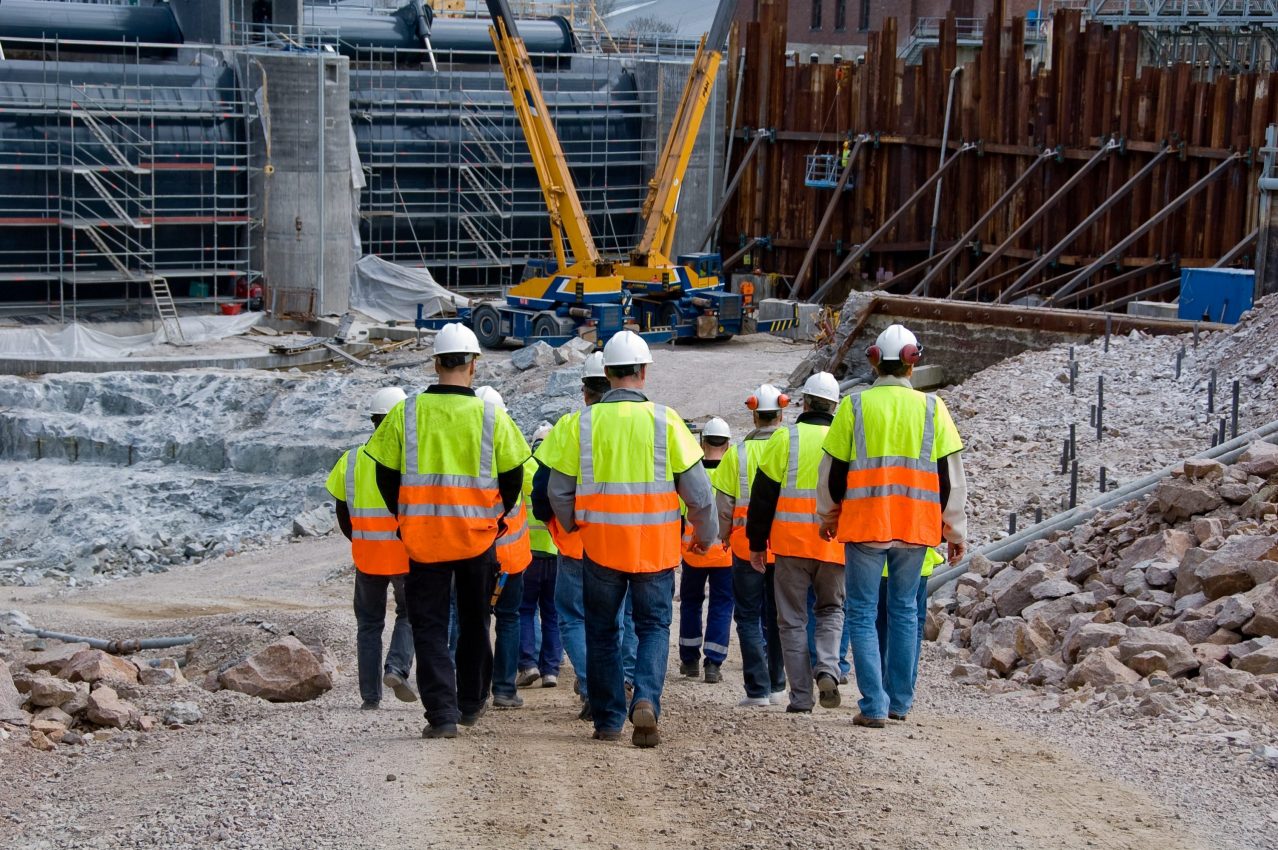
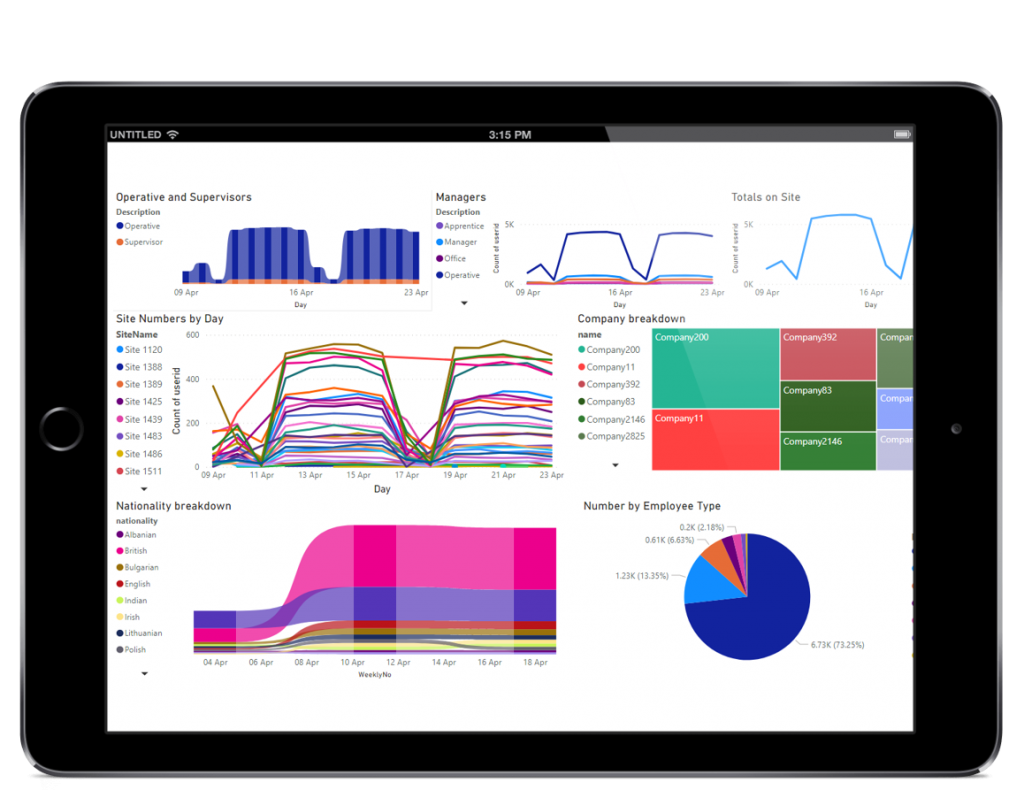
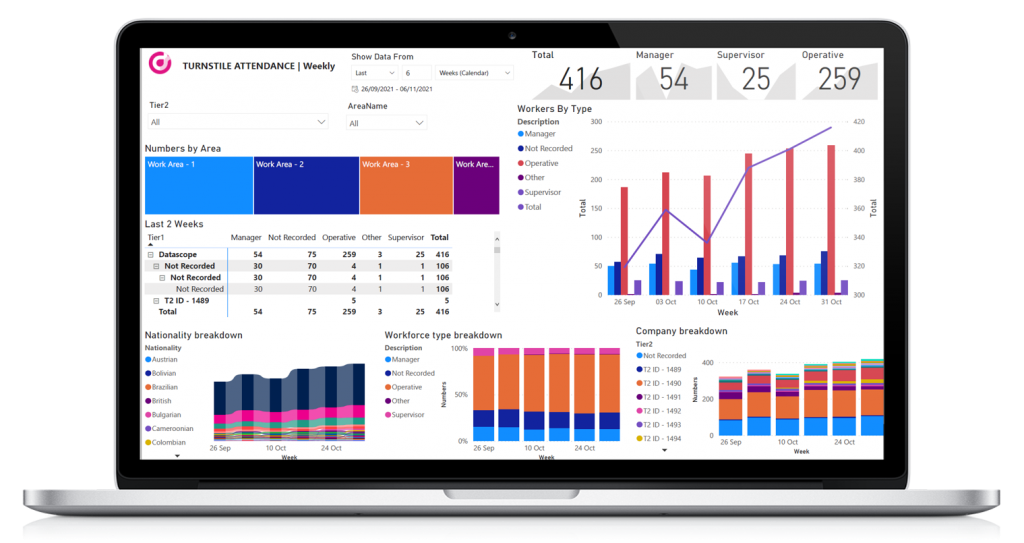
- Workforce
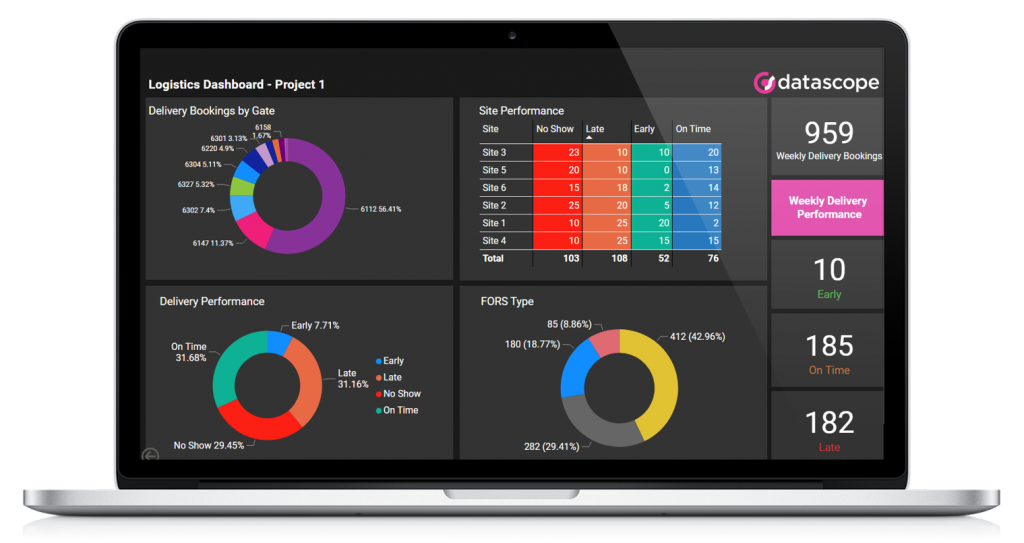
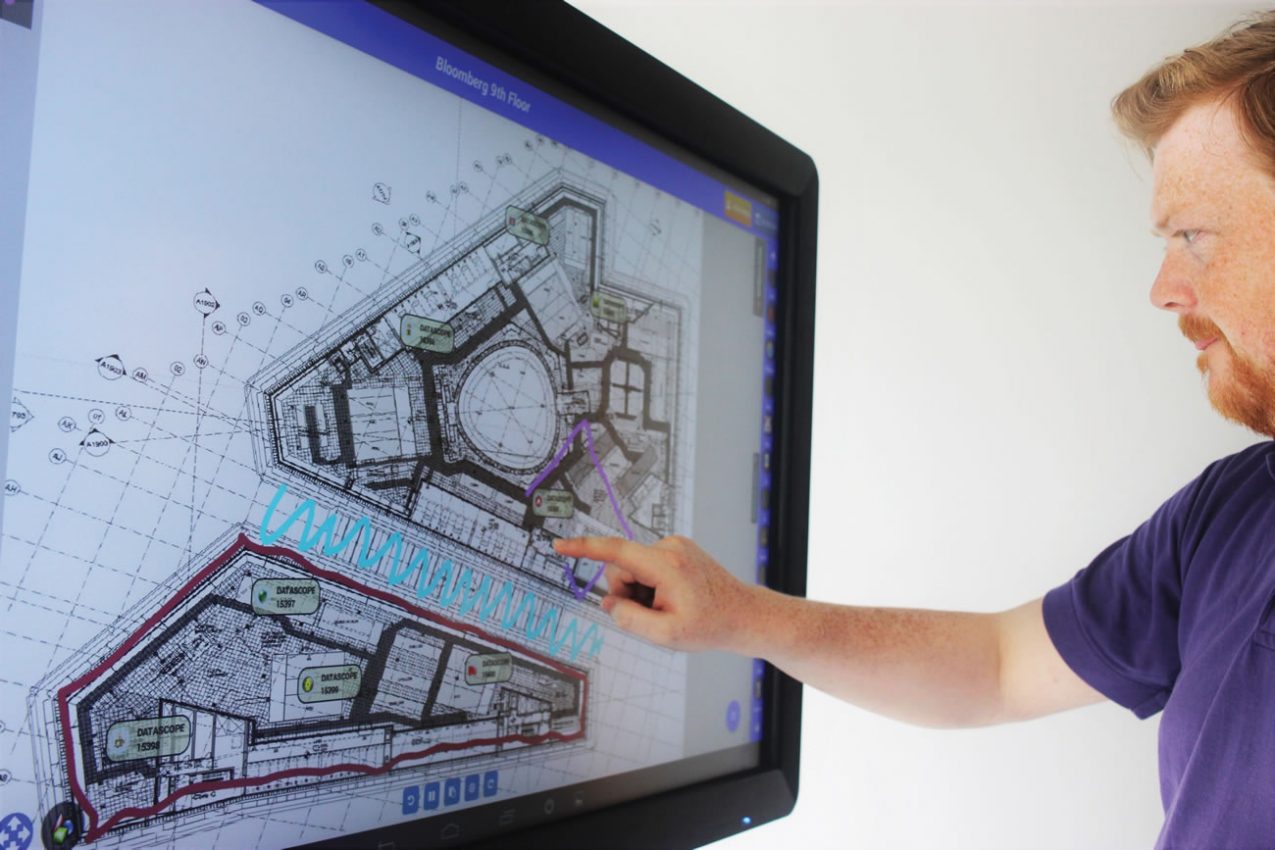
- Logistics
 We offer a range of powerful digital logistics tools that help construction sites, consolidation centres, retailers, airports and more manage their end-to-end logistics process. We currently supply end-to-end logstics systems for some of the UK’s largest airports, retail centres and public service facilities.
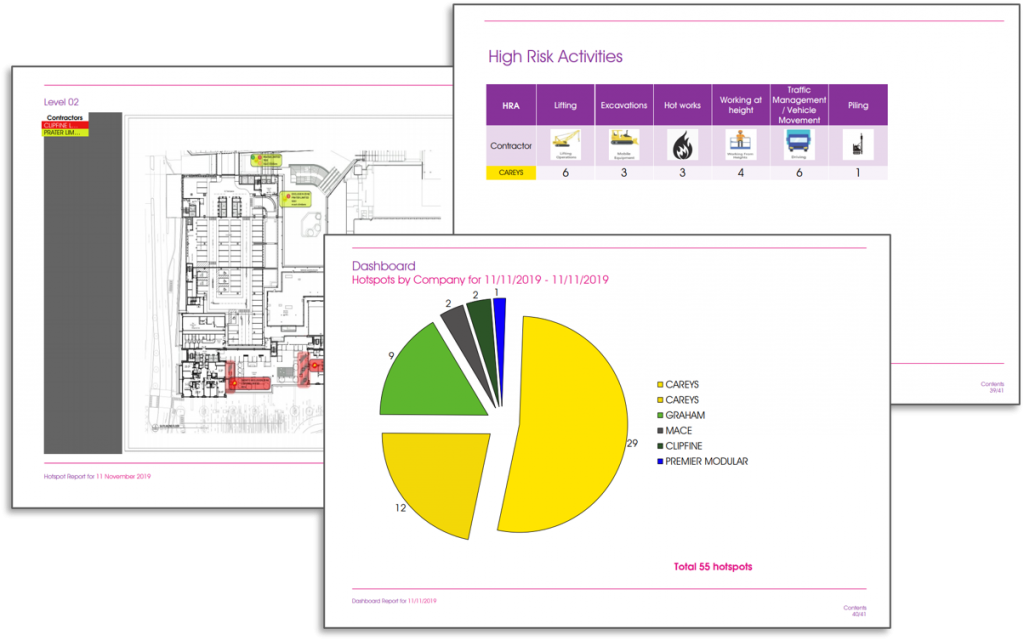
- QHSE
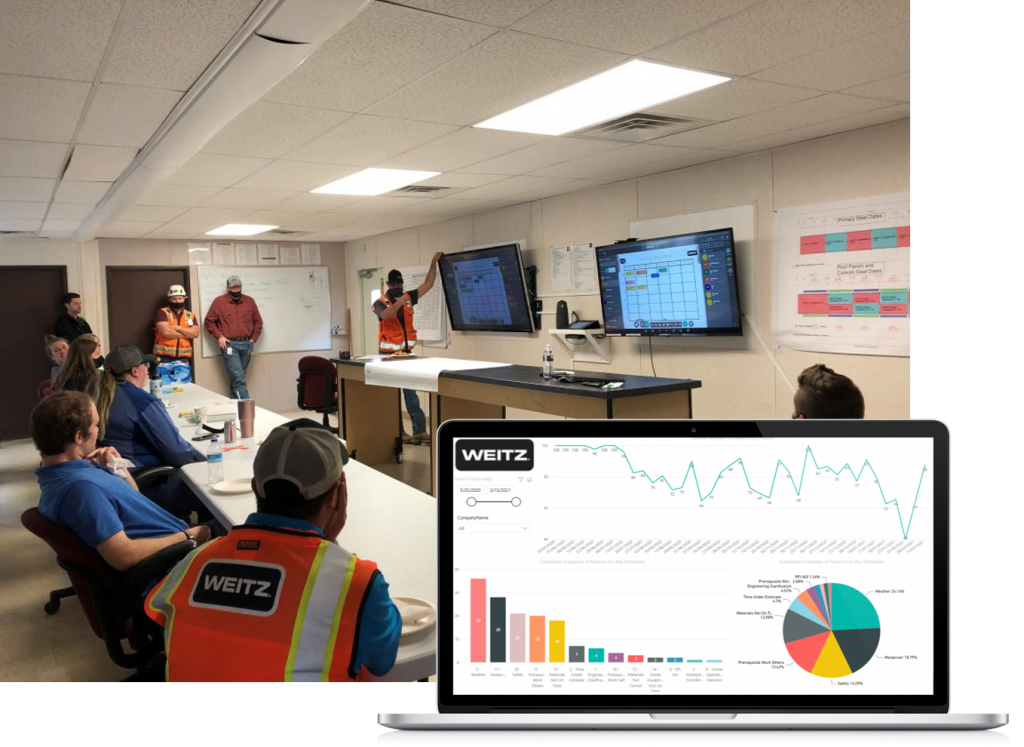
- Planning
 We realise that project planning takes many different forms across the international construction sector. That’s why we’ve built a planning platform that is fully customisable by project, region or customer as required. Be it Daily Briefings, Last Planner or Collaborative Planning, our DataTouch system provides a portal whereby works supervisors and planning teams alike can truly impact schedules and programmes.